In August 2024, Namibia’s annual inflation rate decelerated to 4.4% y/y, down from 4.6% in July 2024 and 4.7% in August 2023, reaching its lowest level since November 2021. The key contributors to inflation were food and non-alcoholic beverages, housing and utilities, and transport. On a month-to-month basis, inflation rose by 0.3%, compared to 0.2% in July. Core inflation, which excludes the most volatile items, edged lower to 3.8% y/y from 3.9% in the previous month.
Goods inflation remained the primary driver of overall inflation, standing at 5.1% y/y, though this represents a slowdown compared to July and August 2023. Services inflation remained stable at 3.4% y/y (Figure 1).
FIGURE 1: HEADLINE VS CORE INFLATION (%) – APRIL 2015 TO AUGUST 2024

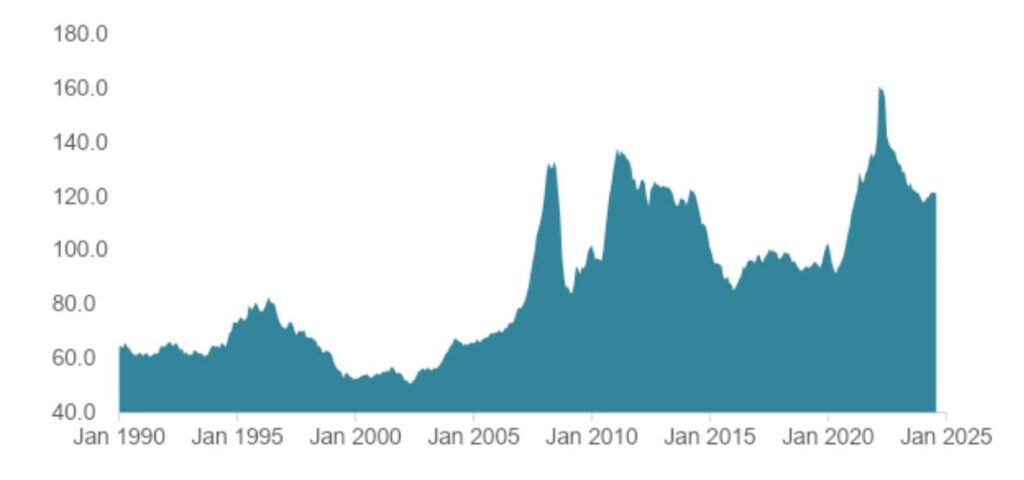
FIGURE 2: FAO FOOD PRICE INDEX – AUGUST 1990 TO AUGUST 2024

The food and non-alcoholic beverages category recorded an inflation rate of 5.2% y/y, marking its second consecutive monthly increase, although it remains significantly below the 10.0% y/y observed in 2023. Price increases in bread, cereals, and oils contributed to this rise, while fish prices decelerated sharply to 0.1% y/y, down from 16.2% y/y in August 2023, driven by lower costs for dried and fresh fish products.
Globally, the FAO Food Price Index stood at 120.7 points in August 2024, slightly below July’s level and 1.1% lower than a year ago. Declines in the prices of sugar, meat, and cereals outweighed increases in vegetable oils and dairy products (Figure 2).
FIGURE 3: RENTAL PAYMENTS FOR DWELLING ANNUAL INFLATION – FEBRUARY 2014 TO AUGUST 2024
FIGURE 4: ZONAL RENTAL PAYMENTS ANNUAL INFLATION – MAY 2016 TO AUGUST 2024

In the housing and utilities category, which holds the largest weight in the inflation basket, inflation rose to 4.1% y/y in August 2024, up from 2.8% in the same period last year. This increase was primarily driven by rent payments, which saw an inflation rate of 4.2% y/y (Figure 3).
Inflation dynamics varied across Namibia’s regions. Zone 2, which includes the Khomas region, experienced the highest inflation at 9.3% y/y, largely driven by transport costs. Zone 1 maintained steady inflation at 1.5% y/y, while Zone 3 continued to face deflationary pressures in rental prices, which have persisted since early 2024 (Figure 4).
FIGURE 5: ZONAL INFLATION IN NAMIBIA (%) – APRIL 2018 TO AUGUST 2024

FIGURE 6: PETROL AND DIESEL 50PPM PRICES GROWTH RATE – JANUARY 2019 TO SEPTEMBER 2024

Global oil prices have declined significantly, with Brent crude dropping below $70 per barrel as of September 2024, the lowest level since late 2021. This decline, driven by reduced global demand—particularly from China—has led to fuel price cuts in Namibia. These cuts are expected to provide much- needed relief to transport-related inflation, which has been a key pressure point in recent months (Figure 6).
Our outlook for inflation in Namibia anticipates further easing, largely due to these fuel price reductions and the anticipated oil market surplus forecasted by OPEC+ for 2025. However, rising food prices remain a concern, posing a risk of offsetting some of the deflationary benefits from lower fuel prices.
SS Thoughts
Given these developments, our initial forecast of 4.9% average inflation for 2024 may be revised downward, likely toward 4.6%–4.7%. The extent of this revision will depend on the continued trajectory of fuel prices and the persistence of upward pressure on food costs.

Simonis Storm is known for financial products and services that match individual client needs with specific financial goals. For more information, visit: www.sss.com.na


